Building a real-time prediction algorithm with Python 3
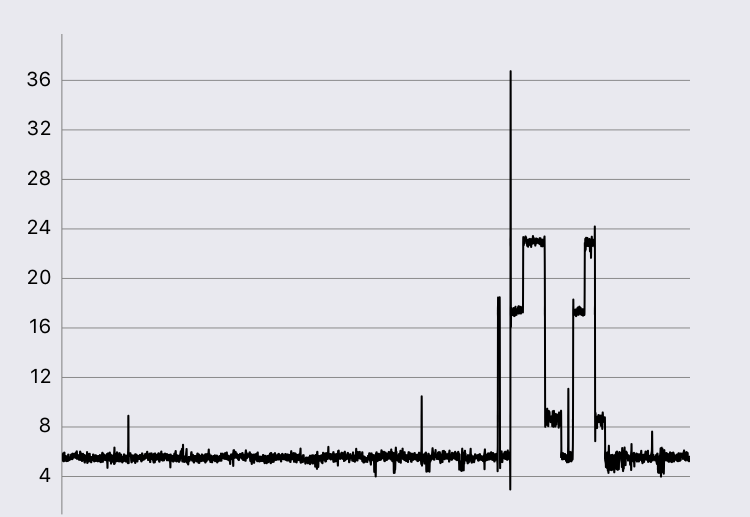
This past month, I recently quit my job to begin working full-time on a hardware IoT product. We work with lots of sensor data that needs to be organized and disaggregated into human-readable signals. An example of a single stream of data that comes through our system looks something like the graph listed below:
One of our goals was to build a prediction system that would be able to in real-time identify what kinds of systems are producing these signals. It was a lot of work, but also very interesting so I figured I would write a little about it here.
the sky-high view
Before I delve into the inner-workings of how the service works, I figure it’ll make more sense to highlight the overall goals and moving pieces of the project. The goal of the entire system is to take in a large number of separate, streaming inputs and classify them individually into the appropriate category. Every given second, these inputs have more than 5 unique features that can be used to help classify what kind of signal it is. The inputs are streaming, so there is no clear start or end state, things happen in real-time, and our system needs to be able to handle that accordingly. Ideally, this computation will be performed as quickly as possible so that the user can get near real-time feedback on what is happening.
The more we thought about the problem, the more we realized that there are two distinct challenges here that can be de-coupled and tackled on their own:
-
event-detection: before we can even classify a signal, we need an actual signal to classify. Because every second we are gaining 10s of new datapoints, the process has to be able to decide when ‘events’ start and end.
-
event-classification: once we have an event, then we can run that event through the appropriate trained models to get a prediction of what that signal represents.
As you can tell, once we break this apart, it becomes slightly less intimidating, we can focus on solving these individually and putting the parts back together. Also, the challenges have different requirements that we were able to take advantage of when designing our system, namely the fact that event-classification is not really a streaming/real-time challenge. Because we can assume that events will be detected in the first part of our system, this portion takes in a single event and does its best to classify it. It doesn’t have to maintain state that needs to be updated with incoming streams (models do need to be trained, but that doesn’t constantly need updating) so it is almost as simple as a function call.
event detection
Based on the graphs above, you can see that the events are pretty clearly defined with sharp increases and decreases. You’ll also notice that there is a decent amount of noise, so if we’re not careful, we might detect some false-positives. We ended up building this with a two-pronged approach, 1) first smooth the signal as best as possible to reduce noise, and 2) begin to actually look for signal changes.
If you google smoothing algorithms, you’ll find dozens of different kinds, each with their own strengths and weaknesses. When deciding which one to use, we wanted to smooth out the signal as best as possible without removing the ‘sharpness’ of the real signal changes so that the actual edge detection would still be able to find it. We ended up using a simple moving average with a fixed window size and found that this did a decent job without removing big picture changes.
Once we have a (relatively) smooth signal, it’s time to pass it on to the event detection portion. If you also google any variant of edge-detection, spike-detection, etc, there are many more scholarly papers, guides, and articles on potential approaches to the problem. The biggest challenge here is capturing the whole signal, it’s easy to accidentally cut off the event if it hasn’t finished yet or to cut off the beginning if this particular event starts slowly. I’m not sure if the approach we took has an exact name, but we maintained an average of 10 points, from the current time to 10 seconds in the future. If the 10th point furthest away was further than 3 standard deviations from the average, then we would record an ‘event start’ and begin looking for the signal to return back to some semblance of a steady state.
Because this is performed in real-time, our algorithm doesn’t have the luxury of examining the entire signal from start to finish and going from there, rather our code has to manage sliding windows and throwing away old, unnecessary pieces of data. We built the application to run two separate processes that communicate using Python’s [multiprocessing queue][multi-queue]. Once the smoothing algorithm has enough datapoints to produce a smoothed point, it gets put in the queue to be appended to the list of datapoints to be run through the event detector. The event detector then produces events that get passed into the event prediction portion of the system.
I don’t want to get too much into the details, but there is one more key point to share. At the beginning of this post, I mentioned that there are multiple streams of data coming in, so the described algorithm has to work and maintain state for multiple sources of data at any given point. To maintain constant-time access to each individual stream’s various states, we use a collection of non-sychronized hash-tables that are used by each process individually. The only data passed between processes is the smoothed data points, each process takes care of hashing the data and storing it accordingly.
event prediction
The next portion is given those signals, transform those into pieces of data that we can pass into the machine learning model that we choose. We built this portion of the system to be completely independent of the event detection service. It currently runs as a simple Flask api that has an endpoint that can be called from the event detector to trigger the prediction calculation. Decoupling the two allows for us to iterate and deploy each portion independent of the other, especially because we don’t want to lose some of the streamed data state on deploys. Since we might want to try many different prediction models, separating these can allow the event detector to not care about the prediction model (or even models!) being used, it can simply dump it into a queue and let it be processed whenever it can be.
As for the algorithm/model we chose, we end up using k-nearest-neighbor as our first attempt because of the ease of training the model on a given number of features. We used the scikit implementation of the algorithm so that we wouldn’t reinvent the wheel. On server restart, the model gets retrained with whatever training data is present, and the model is now ready to receive requests from the event detector to help classify the event. As mentioned before, this portion of the system doesn’t require much work, as it as simple as a stateless function call that only needs some parameters to work each time.
is v2.0 actually better?
Great, so now we have a working v1.0 of our project! What’s next? It works, but obviously we want to improve our algorithms and make our system faster and more accurate. Without actually running all versions through a set of data and seeing which one is more successful, there is not really a way to know if your changes actually improved the prediction quality of your system.
To handle this, we built a system that would allow us to test both the event detection and event prediction quality. When events are detected and predictions created, the system stores those as rows in our database, with metadata like which version of each generated it, the actual prediction, whether or not the prediction was right or wrong, and other things. As we start gaining data that is ‘correct’, we can now add it to our test-suite for running our future algorithms against.
To take it a step further, everytime a pull-request is created for the entire system, the test-suite could be run against it to verify that our new changes that detect some new signal are not breaking the algorithm’s ability to detect older ones.
What’s Next
I learned a lot building this system from the ground-up, and while it’s relatively robust now, there is a lot of room for improvement. Right now, it’s two single processes that handle all event detection and signal smoothing, it is not multi-threaded to be able to process multiple datapoints at once. It works for our current small load of sensors, but in the future we will have to figure out how to handle orders of magnitude greater of datapoints per second.
I’ve been doing some research with Apache Storm, and it seems very promising for our usecase. It handles dealing with passing around streams of data so that we wouldn’t have to build that ourselves, and it does it in a distributed, fault-tolerant manner so that we would be able to scale up. While it sounds great, there is some non-trivial operational complexity that comes with it, so we will have to do some testing with it.
Event detection is also a tricky thing for computers to detect, so I would like to build a small UI to allow for us to review. By adding +/- 10s on each side of the detected event and graphing it, it gives us an easy way to verify that the event is capturing all of the signal without getting too much or cutting off too early.
If this at all sounds interesting to you, email me at my email given below and let’s talk more about it, we could always use the help!